

After 2 months of stable movement in a sideways trend, bitcoin is preparing for a climax. The compression of liquidity or the narrowing of the trading range clearly hints that an impulse exit from the sideways is about to take place. Of course, the community is interested in the main thing — in which direction will the exit take place? Let’s try to analyze possible scenarios in our traditional weekly forecast of the bitcoin exchange rate against the dollar.
BTCUSD Forecast
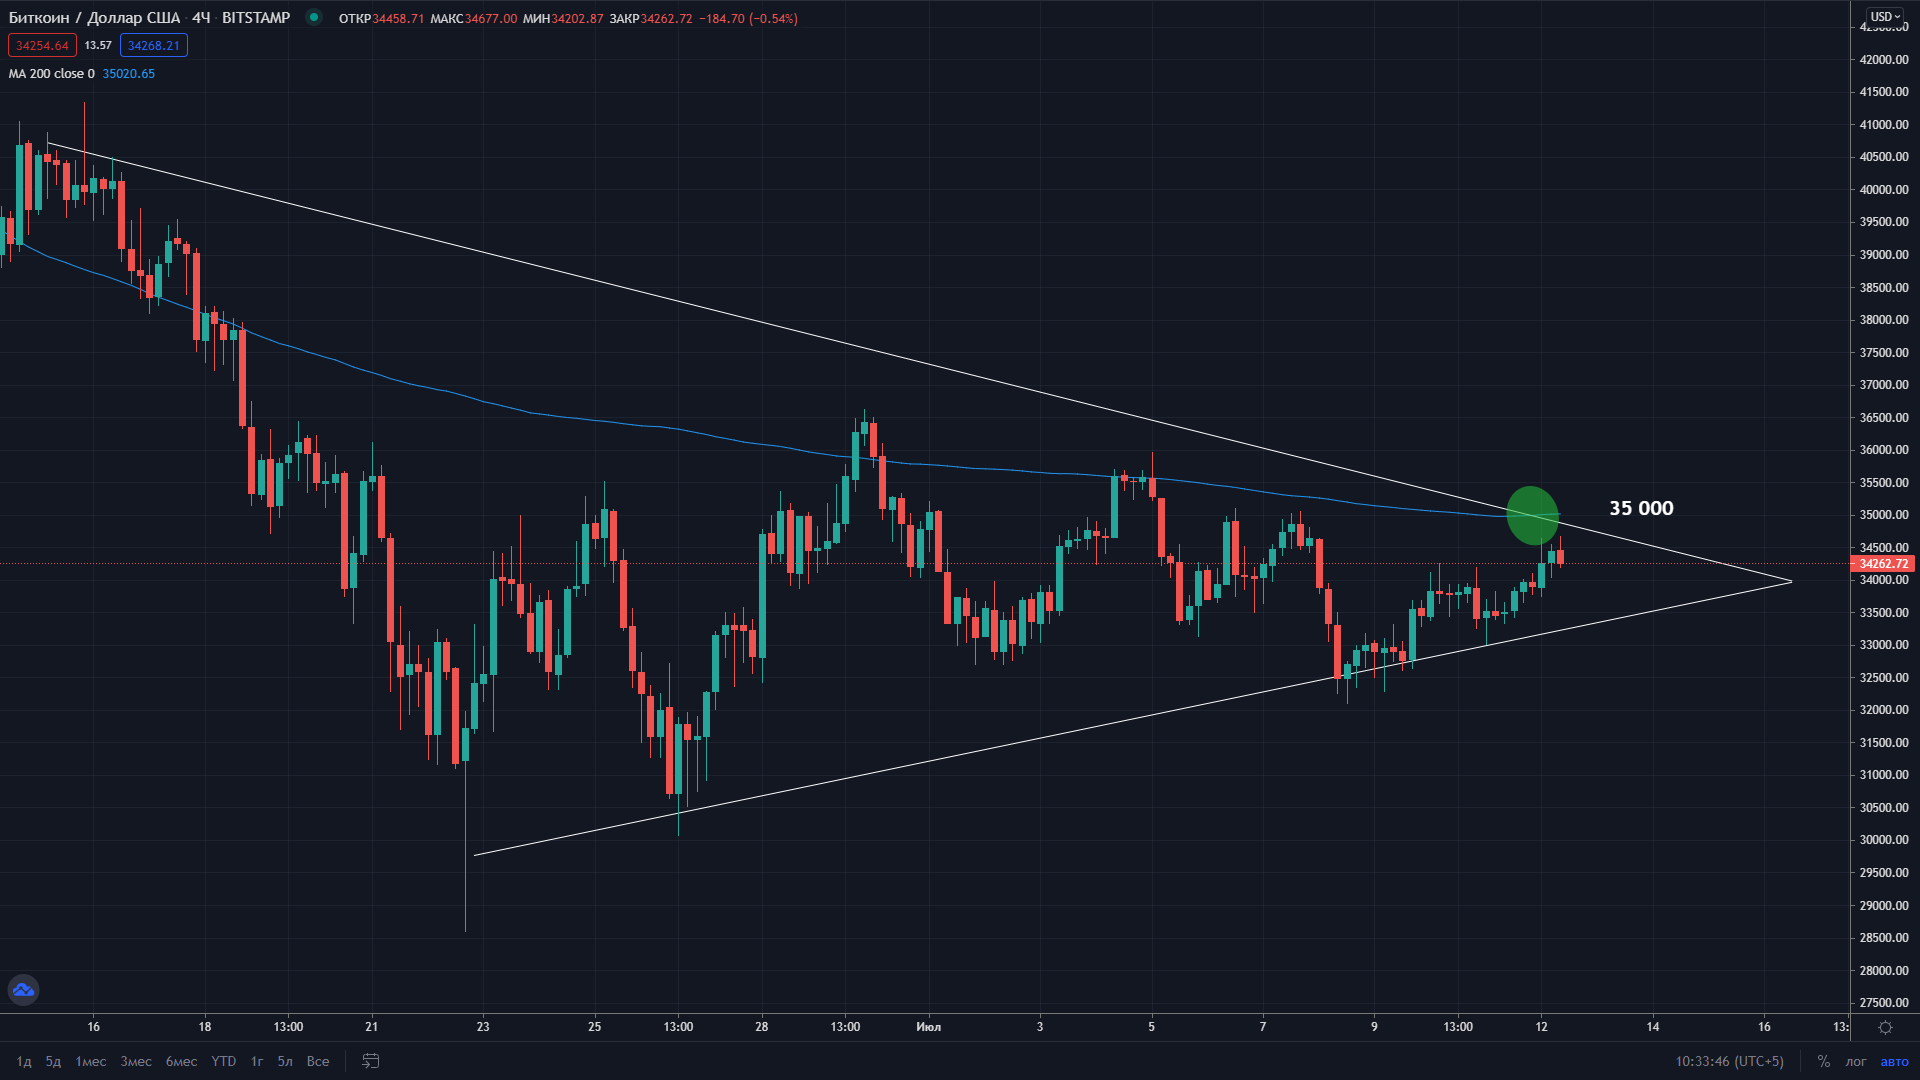
As mentioned earlier, the trading range is narrowing more and more, which indicates that the culmination of a two-month sideways trend is approaching. Price highs are decreasing, and price lows are growing, which complicates the prediction of further movement. In fact, it turns out that sellers cannot push the price lower, but buyers also meet resistance. The moving average on a 4-hour timeframe for 200 periods shows the weighted average cost of BTC in the region of $35,000. This mark, together with the resistance line of the triangle, forms a powerful tandem that does not let the price go up. Meanwhile, large bitcoin holders continue to increase their positions as the value of the cryptocurrency decreases. Thus, the market continues to increase the deficit of the underlying asset, which, of course,is a positive factor in the medium and long term. The counterweight to the strengthening of the position of the whales is the pressure of the Chinese authorities on the crypto industry. The negative fundamental factor does not allow bitcoin and the crypto community as a whole to take a deep breath and finally calmly plan long-term investments in the crypto currency.
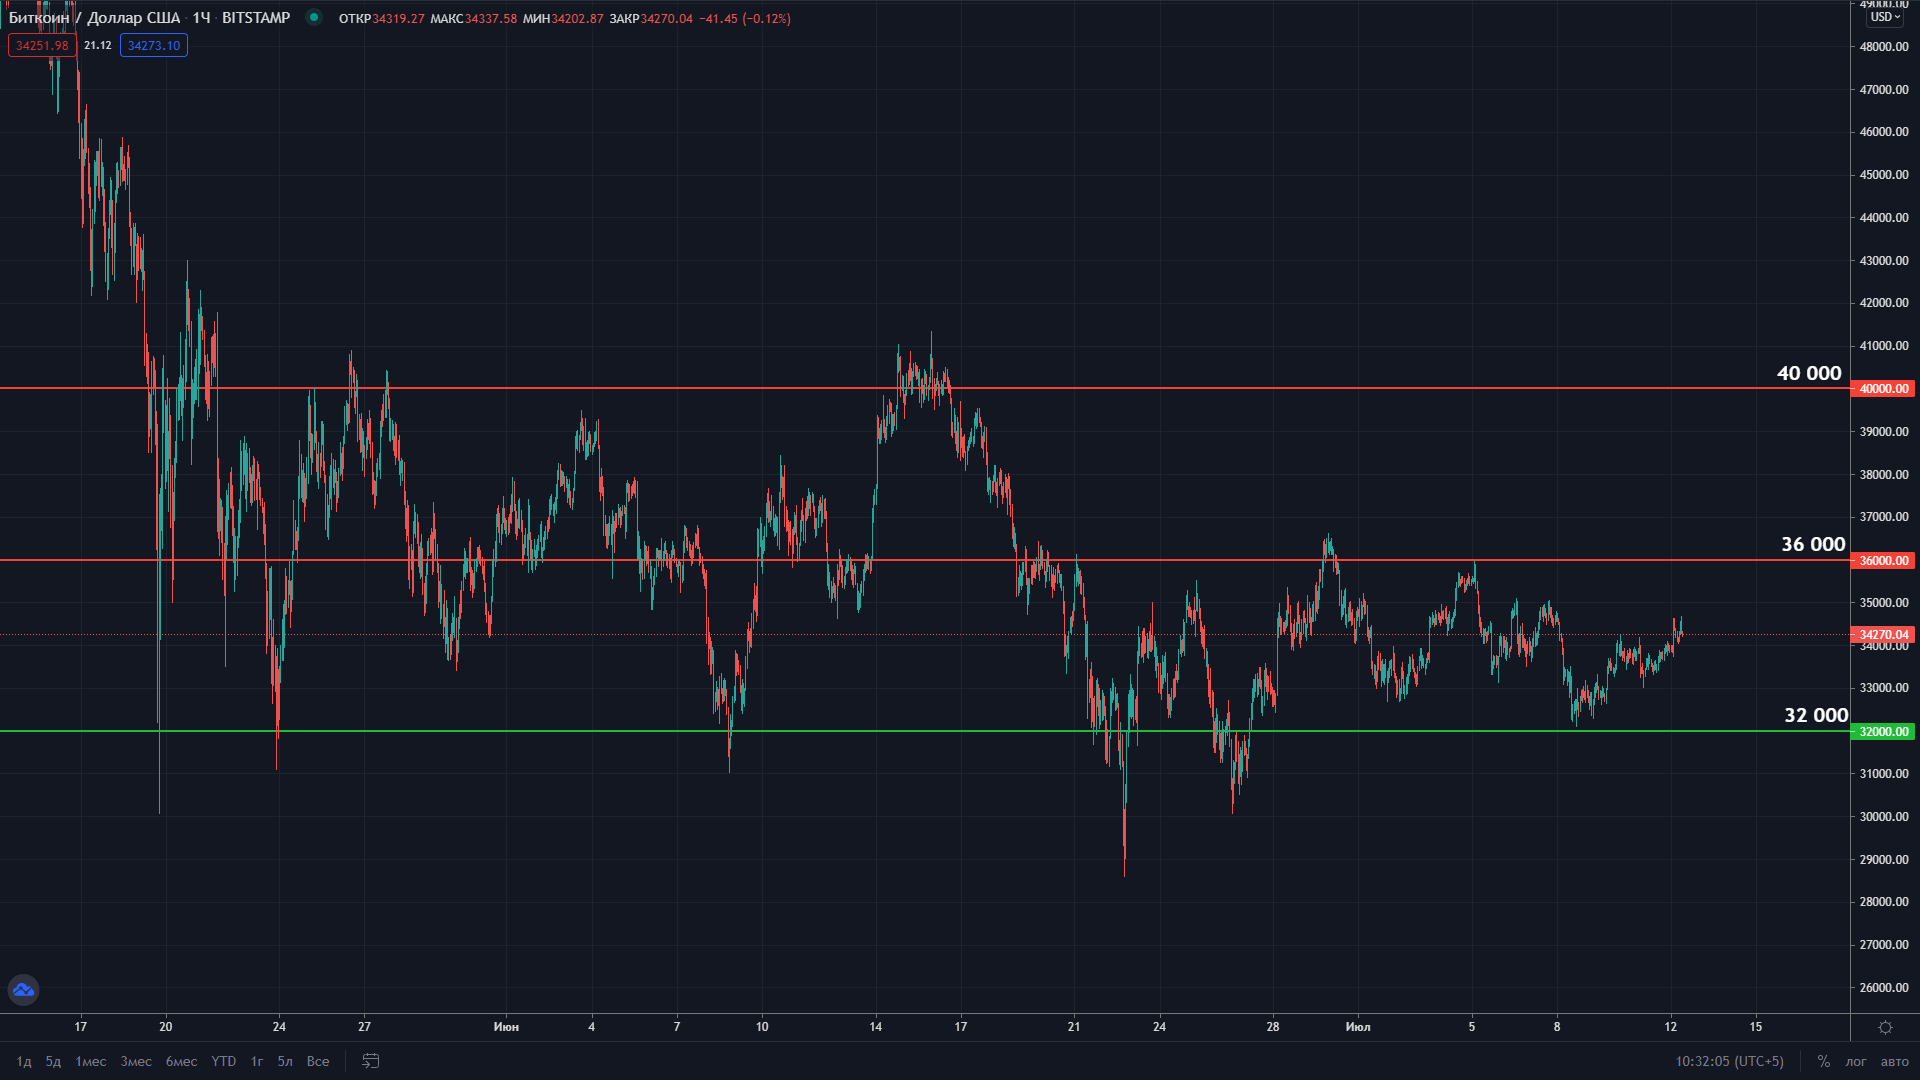
At the moment, the nearest support zone is the $32,000 level. Psychologically, the level of $30,000 continues to be important, which was tested by sellers three times, but all three times unsuccessfully. The nearest intermediate resistance zone is the $36,000 level. The strength of this level is that it puts pressure on buyers, squeezing the trading range. Only after the breakdown of $36,000, it will be possible to say that the price managed to break out of the triangle and went to test $40,000. If the support price breaks through around $32,000, there is a high probability of a retest of $30,000. However, on the 4th attempt, the $30,000 level may not stand, which will open the way for sellers to $24,000.
Taking into account all the “pros” and “cons”: the negative fundamental background and the positive on the part of crypto-whales, our forecast for Bitcoin (BTCUSD) for today, tomorrow and the week from July 12 to 18 is the culmination of a sideways trend, with a subsequent exit either above $36,000 or below $32,000.