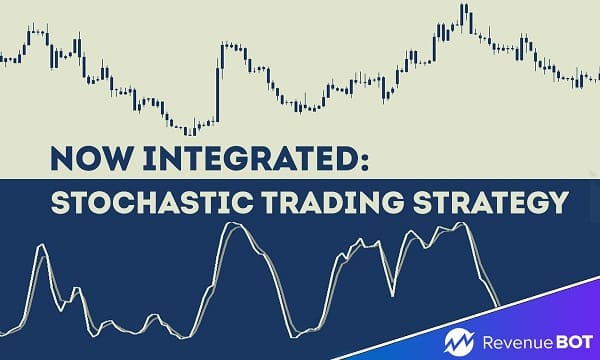
We introduce a stochastics oscillator (in other words, an indicator comparing a particular closing price of a security to a range of its prices over a certain period of time) aimed at detecting trend reversals and other changes in it.
General info:
- Stochastic operates based on two bands/lines: %K-fast and %D-slow
- We are using the default Stochastic indicator settings – 14/3/3 (these are used to display the location of the close compared to the high/low range over a user defined number of periods);
- The indicator values range from 0 to 100;
- Readings under 20 are considered oversold. Exit from the oversold position is a buy signal;
- Readings over 80 are considered in the overbought range. Exit from the overbought position is a sell signal;
You can access a number of the strategy variants offered on the basis of Stochastic:
- Stochastic LONG1: triggered if the %K line crosses the %D line from bottom to top;
Stochastic SHORT1: triggered if the %K line crosses the %D line from top to bottom; - Stochastic LONG2: triggered if the %K and %D lines cross the X value from bottom to top, X default 20;
Stochastic SHORT2: triggered if the %K and %D lines cross the X value from top to bottom, X default 80; - Stochastic LONG3: triggered if the %K line crosses the %D line from bottom to top as well as if both lines are below X, X default 20;
Stochastic SHORT3: triggered if the %K line crosses the %D line from top to bottom as well as if both lines are above X, X default 80.
To learn more about the differences between these filters and how to enable them, check out our Knowledge Base.
