

Nowadays cryptocurrency trading is a hot pick among investors since you are able to generate higher profits compared to doing so but in traditional markets. With each passing day technical indicators advance while data processing methods improve as well so that trading becomes more convenient and straightforward.
Over the past few years, it has become clear that the crypto market now responds to news matching to the traditional one. Say, an another rate hike by the Fed indicates whether or not there will be cheap money available. If this is the case, an asset responds with a surge in value, if not – collapse is underway then. The crypto market has become full-fledged, which is why cryptocurrencies are responding to any news in such a way. However, this does not even suggest that the amount of potential earnings in this sector has diminished somehow.
We believe that in order to ensure a profitable transaction you need to adopt a comprehensive approach – that is, you must use a set of technical indicators rather than just data on upcoming economic events. Here at RevenueBOT, we strive to remain up-to-date by offering our users an automated trading feature through bots and integrating the calculations of the latest indicators onto its platform.
Indicators breakdown
As of now, we are proud to offer you a set of indicators as follows:
- RSI (Relative Strength Index) – displaying the speed and magnitude of recent price changes. Values usually range here from 0 to 100. If the figure is above 70, it implies that the asset is overbought, and should it go below 30, it is considered oversold. RSI is useful in signaling potential trend reversals.
- CCI (Commodity Channel Index) – showing how much the current price has deviated from the historical average. If the value is over +100, the asset is in an overbought condition, whereas if it goes below -100, the asset is oversold. Moreover, CCI is used to determine the beginning and end of market cycles.
- Bollinger Bands – these include a middle line, upper bands and lower bands, all of which are at a certain distance from the middle one while also depending on market volatility. Once the price hits the upper or lower band, it may indicate that the asset is overbought or oversold.
- Stochastic (Stochastic Oscillator) – needed for comparing the current closing price with the price difference for the selected period. It consists of two lines: %K and %D. An asset is becoming overbought at a value above 80 and oversold at a value below 20.
- MACD (Moving Average Convergence Divergence) – revealing changes in the strength, direction and momentum of a trend. It consists of the MACD line (which represents the difference between two moving averages) and the Signal line (which is a moving average of the MACD Line). Should the lines cross, it may point to a signal to either start or close a trade.
- Finally, our native indicator called RB shows how many times the price of the asset has changed over the past 1, 3, 6 and 24 hours using 1 minute intervals. What this very indicator actually measures is how frequently and how dramatically the price of any given trading pair moves. Your trading bot will start working only when it meets the required number of such price movements during the specified timeframe. By default, the price change is recorded if it shifted in both directions by at least 0.5%.
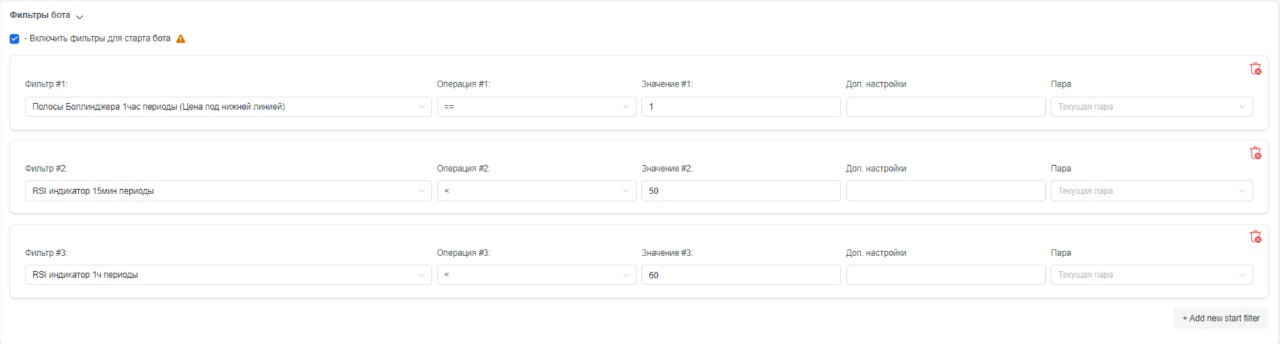
With some first-hand knowledge, if you opt for the LONG algorithm when using your trading bot, a combination of Bollinger Bands with one period and RSI below the 55 mark would be effective, as well as setting a 1% margin in the bot to get an optimal entry point, followed by a trend reversal.
You can use RevenueBot indicators both individually and in conjunction with some other indicators so as to predict price movements even more accurately.
To this day, there exist thousands of indicators, if not millions of them. There are also some perfect off-the-shelf solutions, with TradingView being the best signal provider. The platform is integrated with RevenueBot so our users can link their desired indicator or strategy smoothly.
Please refer to our step-by-step guides on how to integrate RevenueBot products with TradingView, as well as how to leverage the signals provided on the platform:
RevenueBot – your proven partner in the cryptoverse, with its bots delivering the ultimate in efficiency and usability! By using our automated trading bots, you are to accomplish your financial goals far more speedily and securely.