In this article, we will tell you how to choose the most appropriate and effective pair of cryptocoins to trade. To do this, let’s take a closer look at the new indicators in the summary table, available in the Tools menu, the Volatility Indicators tab:
1) Volatility Indicator (RB indicator)
In order to get more income from the Revenuebot trade, it is important to select a suitable trading pair that has good volatility.
To do this, we calculated the volatility indicators (RB indicators) for each of the trading pairs represented on the cryptoviruses.
The volatility indicator (RB indicator) is the number of multidirectional price fluctuations of 0.5% over the last 1, 3, 6, 24 hours in 1-minute intervals.
2) the Risks of trading
In addition to good volatility, it is important to understand trade risks. To assess the risks of a trading couple, various trade signals and indicators need to be analysed. An important indicator for determining the risk of a trading pair can be the RSI indicator. This indicator reflects the trend strength, the values vary from 0 to 100. If the value is greater than 70, it is said that the market is bought, the values are less than 30 signal the resale of the market.
The volume of trading over the last 24 hours and whether there has been a pump/dump in the near past can be a determining indicator for trade risk assessment and matching.
For a comprehensive estimation of the trading pair, we have compiled all the above indicators in the summary table of volatility indicators available in the Volatility Indicators tab.
The table is as follows:
RB indicators for the last 1, 3, 6, 24 hours are presented in columns:
The cells in these columns also show the percentage of price increases or decreases over the selected time period. By setting the descending order in the desired column, you can see which trading pairs are most volatile for the selected time period.
RSI indicators for the last 3, 6, 24, 48 hours are presented in columns:
24h volume — The trading volume for the last day is presented for each of the trading pairs in the column
Pump/Dump – Information about whether there was a pump / dump for the last day is presented in the column
Thus, you can always estimate the volatility of the trade pair chosen by you, the risk of trading, and also choose another on the basis of derived indicators.
Select a cryptopair to trade with a specific example
Let’s take an example of the output in the table of volatility indicators and how to use it:
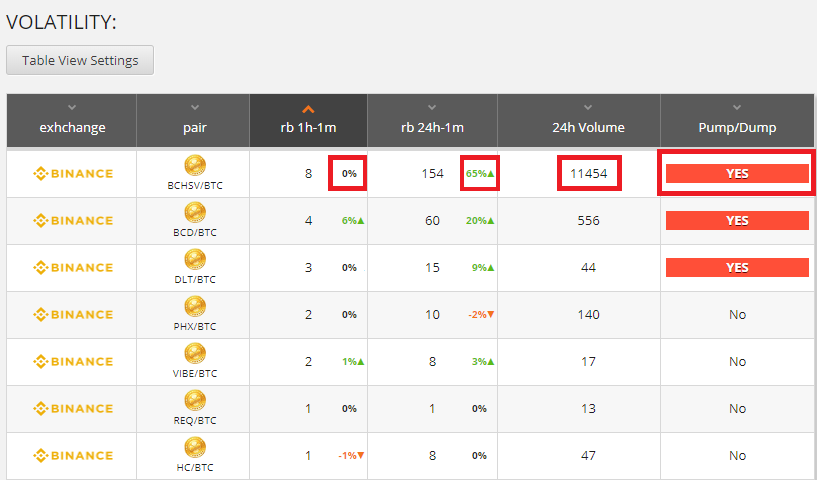
By clicking on the Volatility Indicators tab https:///app.revenuebot.io/office/tools/volatility-indicators, we see the table output

The default table rows are sorted by rb 1h-1m to show the user the most volatile trading pair in the last hour.
As you can see, the BCHSV/BTC trading pair is in the first place, which has changed in price by 0.5% 8 times in the last hour, and 154 times in the last day.
We also see the trading volume for the day of 11454 BTC and the fact that the BCHSV coin increased in price for the day by 65% (there was a pump), but over the last hour the price growth stopped, amounting to 0%.

Thus, by taking the first 5-15 coins from the table, we can find the trade pair most appropriate to our trading strategy
Choosing an appropriate trade strategy
1) Rare management
Some users are not prepared to spend a lot of time working with the bot, but want to set up once and rarely come in and check the statistics, getting a little bit of profit, but without much risk (average is 0.2-0.7% of the deposit per day). Such users need to select the trading pair very carefully, assessing all risks. Don’t choose a coin that is subject to frequent pumps/dumps, the trading volume for which is less than 100 BTC per day, as well as little-known and new cryptomonets. Also remember to adjust the filter for bot start. In addition, recommend that such users split the depot for trading on several reliable trading pairs and use not very aggressive order grid settings, the main ones are the percentage of price change overlap, recommend using >=30% and the percentage of profit we recommend using <1%. The number of orders in the grid of orders and the percentage of martingale (how much % each subsequent order in the grid of orders will be larger than the previous one) should be selected based on the size of the deposit, since there are restrictions on the minimum amounts of orders on exchanges and with small deposits it is impossible to break this deposit into 20-30 orders.
2) Permanent participation in the management of bots
There are users who are willing to spend a lot of time, control trading, change bot strategies and settings to get more profit. For these users we recommend using the most volatile trading pairs, which can be traded right here and now profitably until a certain point as long as there is time to track how the bot is trading and to leave the trade after a short period of time or when there is no possibility to monitor bot work any longer. In this case it is possible to use aggressive settings of the order grid, defining the setting is the percentage of price change reversal overlap (rate cover), which can be reduced to 15%. It is also set up a logarithmic distribution of orders with an increased coefficient (>1.5) to get a higher density of orders at the current price on the exchange, in order to involve more deposits in trading.

